实现ECharts双Y轴刻度对齐。
数组中的空位
需求
系统中有这样一个图标,X轴为天,双Y轴,左侧为百分比,右侧为当日各种车辆数目的汇总,理想状态如下:
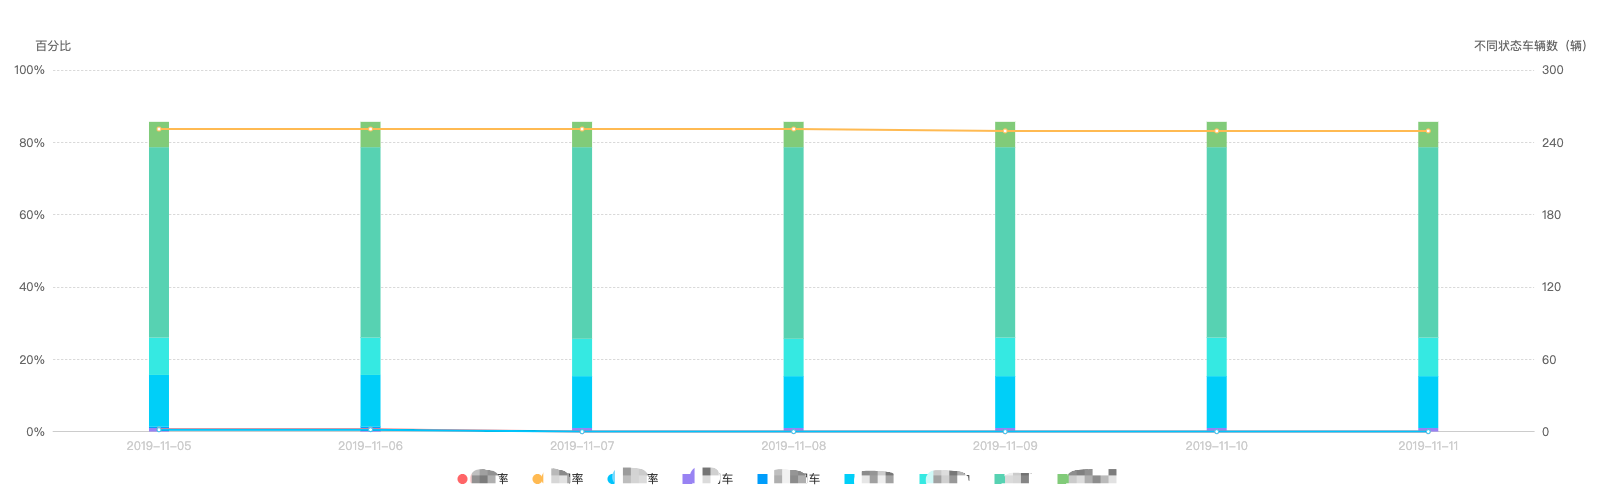
但是线上发现了问题,由于左侧Y轴是强制按照20为间隔进行分割,而右侧没有设置分割,是有Echarts自动计算得来,按照50进行分割,Y轴总共分割为5份,当右侧Y轴的max为250时,恰好左右侧Y轴可以对其,但是当右侧外轴的max为300时,那么两个Y周的刻度就不会重合,不是很美观:
需要解决这个问题
手动计算最大值
解决这个问题,就需要指定两个Y轴的最大值、最小值和间隔,让两个Y轴刻度强制对齐。以左侧外轴为基准,min为0,max为100,interval为20,右侧Y轴也按照这样的比例手动计算max和interval
首先计算出max,其实Echarts的max属性可以接受一个函数作为值,函数的参数value包含两个属性max和min就是各个系列(我的例子中就是按天为单位的数组)的实际最大值。但是为了动态计算间隔,我没有使用这个参数,而是手动计算了最大值:
1
2
3
4
5
6
7
8
9
10
11
12
13
14
15
16
17
18
19
20
21
22
23
24
25
26
27
28
| function getCeilMaxSumByColumn(arr = []) {
const DEFAULT_MAX = 100;
const IDEAL_INTERVAL = 50;
if (arr.length === 0) {
return DEFAULT_MAX;
}
const getMaxSumByColumn = arr => arr.reduce((result, current) = > {
current.forEach((num, day) = > {
if (!result[day]) {
result[day] = {
total: 0
};
}
result[day].total += num;
});
return result;
}, []).sort((a, b) => b.total - a.total)[0].total;
const max = getMaxSumByColumn(arr);
if (max <= 0) {
return DEFAULT_MAX;
}
return Math.round(max);
},
|
然后在第二Y轴的设置中,max就取这个值,interval取max * 0.2,结果如下:
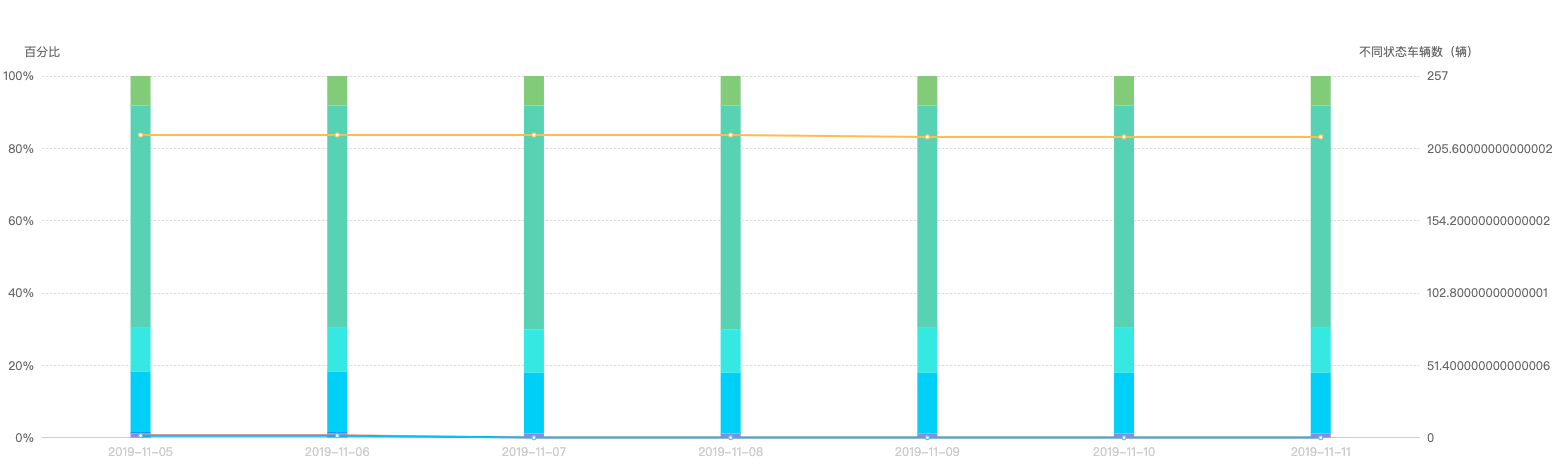
可以看到,两个Y轴对齐了,但是为了对齐,右侧Y轴的刻度会有小数,虽然可以通过formatter来消除,但是结果仍然不是整齐的数字,所以对上面的函数进行了优化,按照50为间隔来取max,比如5,结果就是50,51对应100,105对应150,计算的方法一开始难住了我,后来发现也没那么难,挺简单,对结果除以50,取结果的整数部分向上四舍五入,然后再乘以50即可:
1
2
3
4
5
6
7
8
9
10
11
12
13
14
15
16
17
18
19
20
21
22
23
24
25
26
27
28
29
30
31
32
33
34
35
36
37
38
39
|
function getCeilMaxSumByColumn(arr = []) {
const DEFAULT_MAX = 100;
const IDEAL_INTERVAL = 50;
if (arr.length === 0) {
return DEFAULT_MAX;
}
const getMaxSumByColumn = arr => arr.reduce((result, current) = > {
current.forEach((num, day) => {
if (!result[day]) {
result[day] = {
total: 0
};
}
result[day].total += num;
});
return result;
}, []).sort((a, b) = > b.total - a.total)[0].total;
const max = getMaxSumByColumn(arr);
if (max <= 0) {
return DEFAULT_MAX;
}
return Math.ceil(max / IDEAL_INTERVAL) * IDEAL_INTERVAL;
},
|
结果:
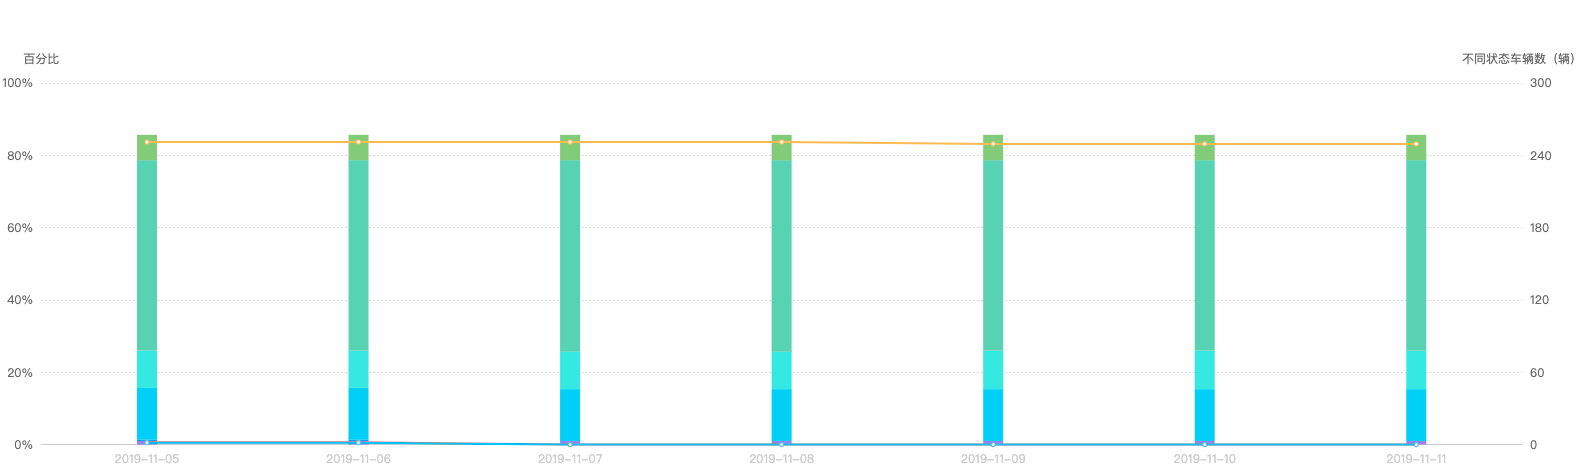
Done!
参考